Specialists in Mechanical Testing and Reliability of Optical Fibers
![]()
![]()
![]()
![]()
![]()
![]()
Specialists in Mechanical Testing and Reliability of Optical Fibers
|
|
|
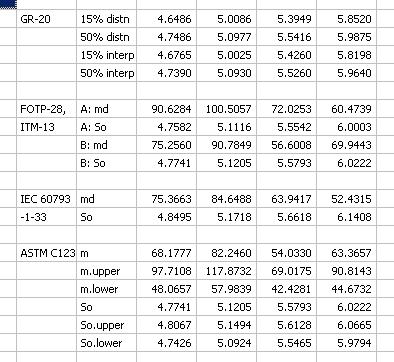
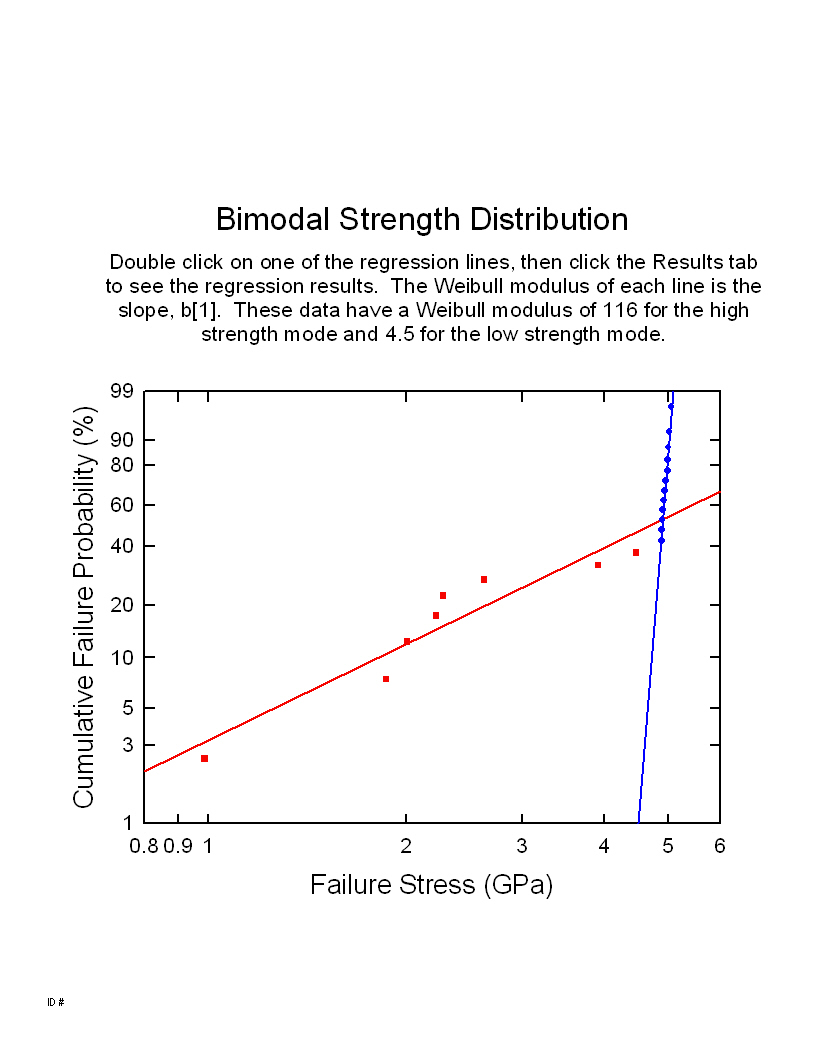
Data Analysis and Graphing SoftwarePurposeWe supply specialized software for producing a variety of graphs in publication quality. The software comprises plug-ins for SigmaPlot (Systat Software, www.systat.com). The customer must own a registered version of SigmaPlot. Weibull PlotsThis Weibull Analysis plug-in for SigmaPlot graphs up to ten sets of data on a Weibull probability plot. Data can be supplied in a variety of units (MPa, GPa, strain, failure load, etc.) and are automatically converted to consistent units. Two example graphs are shown below. The plug-in calculates the Weibull parameters using standard linear regression techniques. In addition, the parameters and their confidence intervals are calculated using an unbiased maximum likelihood estimator (MLE) technique. Linear regression is not an appropriate technique for determining distribution parameters because the underlying assumptions are not valid for this application. In particular, linear regression greatly underestimates the confidence in the parameters. The MLE technique is designed specifically for determining distribution parameters and the parameter confidence intervals are correctly estimated. Calculations are also made using techniques specified in standard test procedures, such as FOTP-28, ITM-13, IEC 60793-1-33, ASTM C1239, etc..
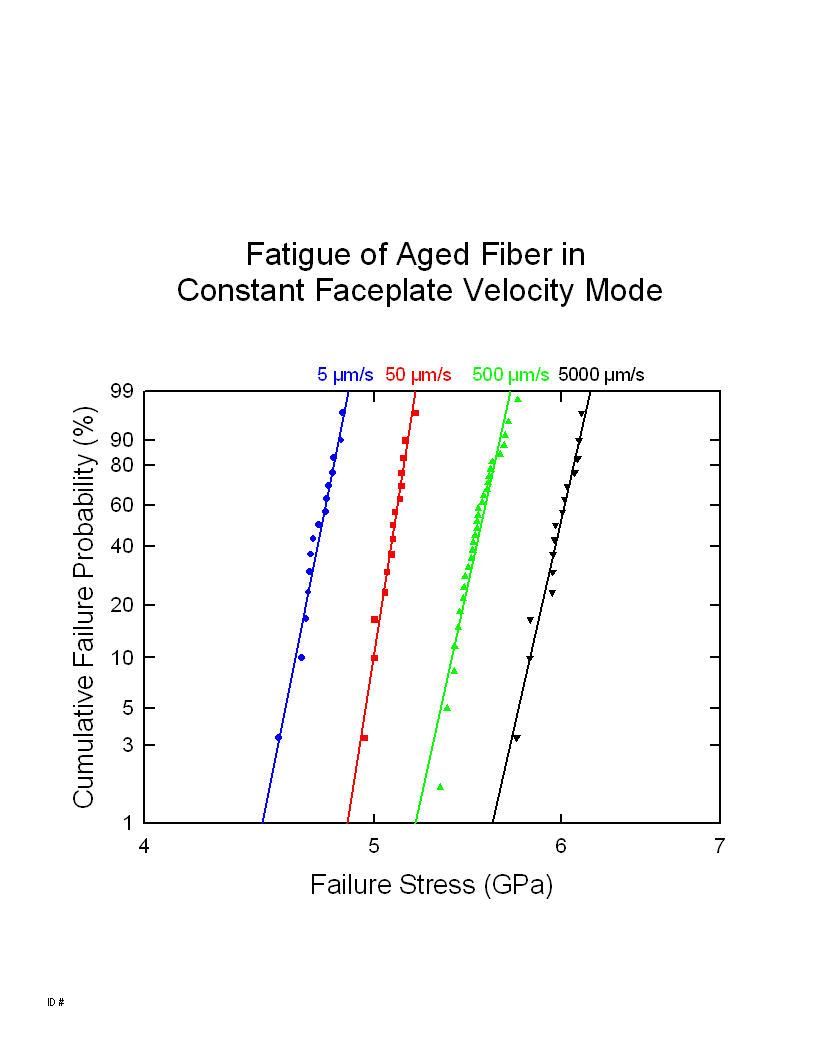
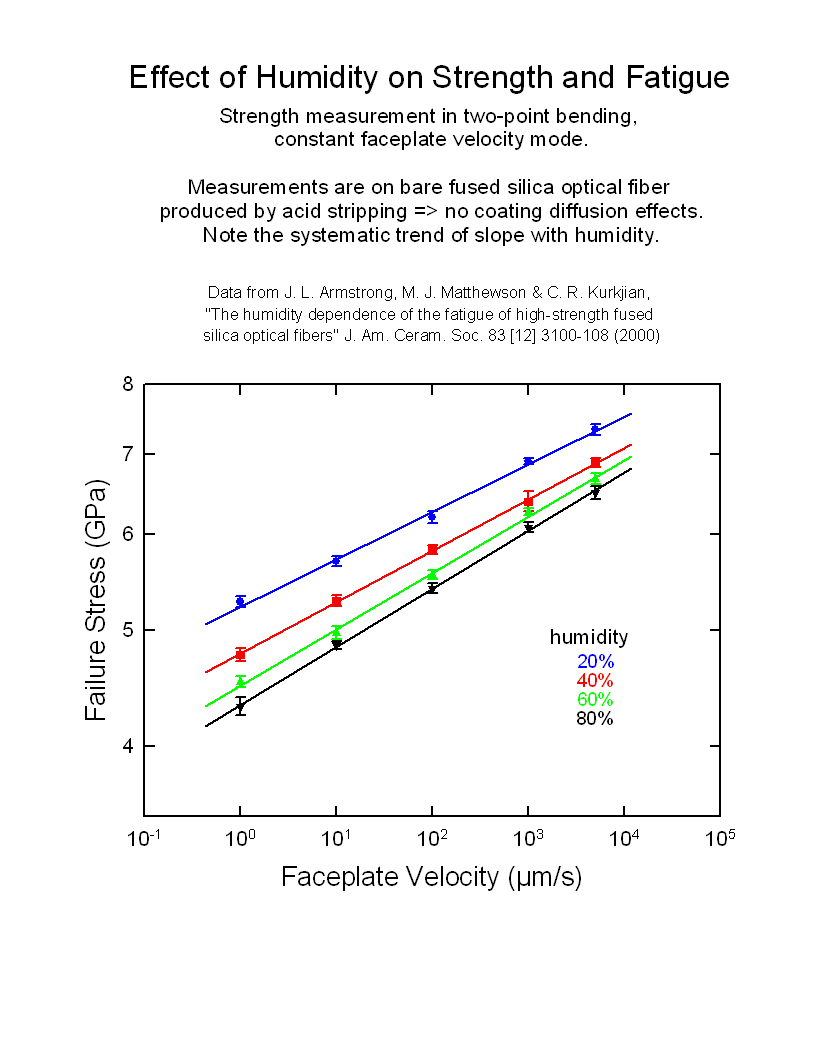
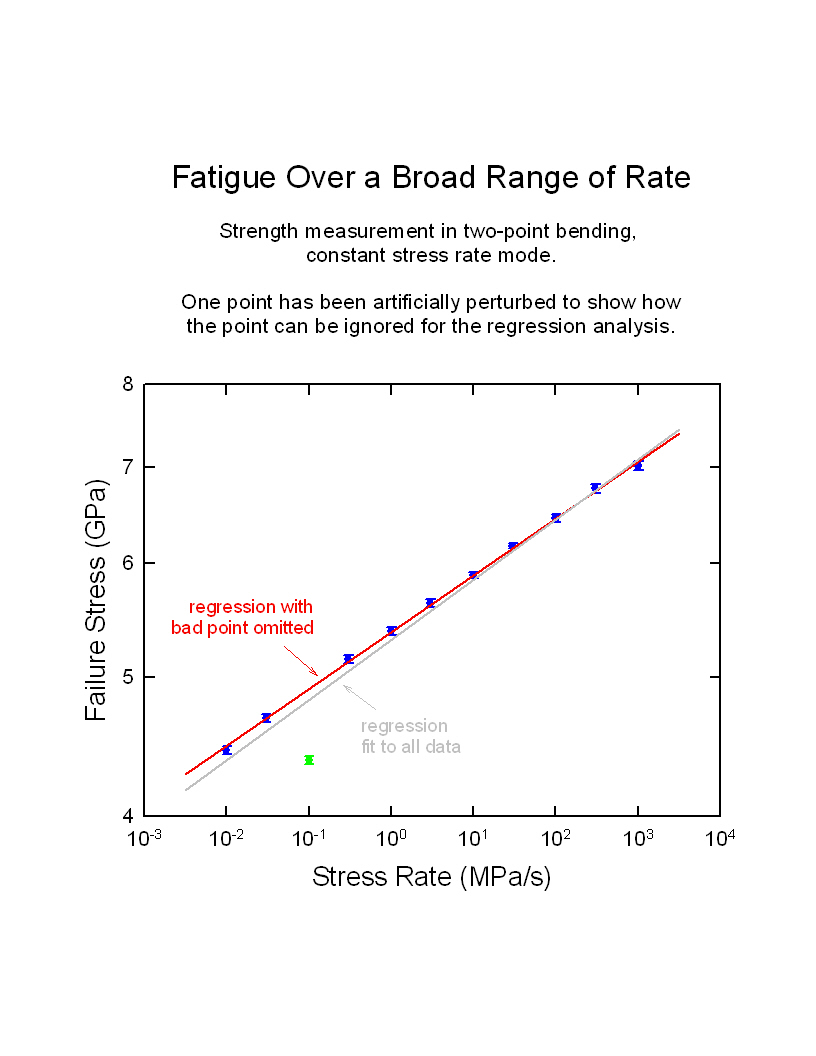
Dynamic Fatigue PlotsThe Dynamic Fatigue plug-in for SigmaPlot graphs up to six sets of data on a standard fatigue plot (log strength versus log rate). Data can be supplied in a variety of units (MPa, GPa, strain, etc.) and are automatically converted to consistent units. Two example graphs are shown below. The plug-in calculates the fatigue parameter, n, using techniques specified in standard test procedures such as FOTP-28, ITM-13, IEC 60793-1-33, etc.. Several customizations are implemented, such as ignoring the weakest at each rate as specified in FOTP28.
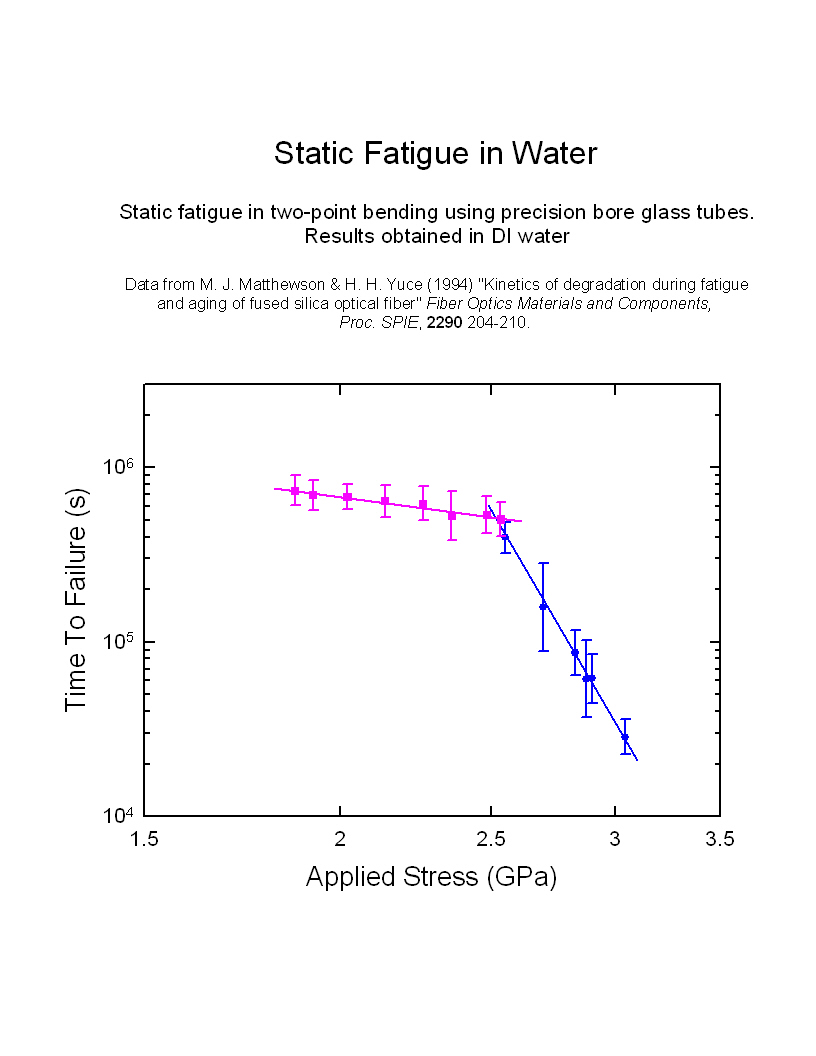
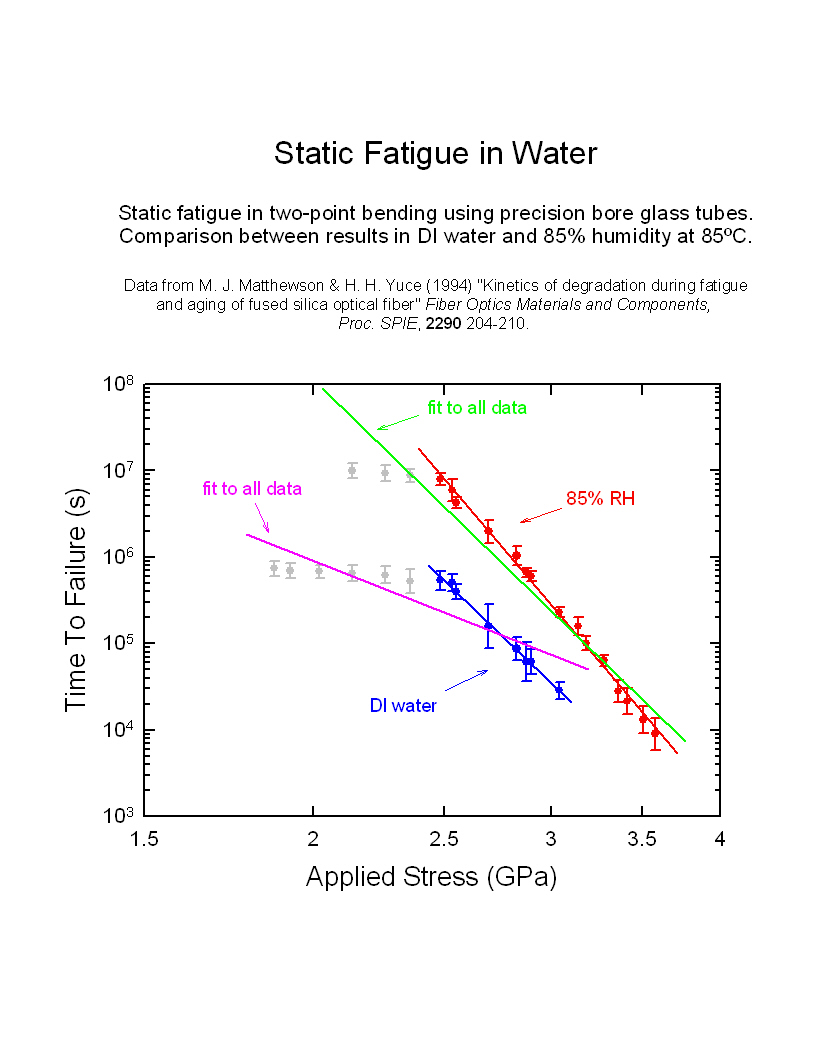
Static Fatigue PlotsThe Static Fatigue plug-in for SigmaPlot graphs up to six sets of data on a standard static fatigue plot (log time to failure versus log applied stress). Data can be supplied in a variety of units (seconds, minutes, hours etc.) and are automatically converted to consistent units. Two example graphs are shown below. The plug-in calculates the fatigue parameter, n, using techniques specified in standard test procedures such as IEC 60793-1-33 etc..
Ordering Information
| ||||||||||||||||||||||||||||||||
|