Specialists in Mechanical Testing and Reliability of Optical Fibers
![]()
![]()
![]()
![]()
![]()
![]()
Specialists in Mechanical Testing and Reliability of Optical Fibers
|
|
|
TENSION for WindowsTENSION for Windows is a sophisticated control program for tension testing optical fibers. To overcome the lack of real time support in Windows then TENSION system includes a dedicated high performance microprocessor for controlling time critical functions such as controlling the stepper motor which is used to load the fiber, and the ADC (analog to digital converter) system for measuring the load applied to the fiber.
Please contact us for
pricing information for TENSION for Windows.
TENSION for Windows Features
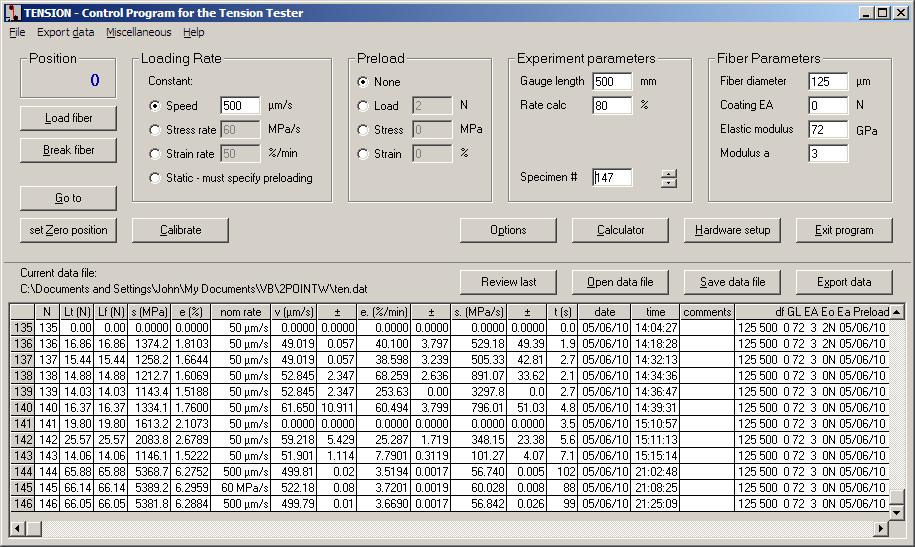
The image above shows the main window
of TENSION for Windows. All
key
experiment parameters are visible and can be quickly changed. A variety
of options and sub menus are available by clicking a button or via the
menu bar. The main screen incorporates a table showing all
results
contained in the current data file. This table can be manipulated
in various ways:
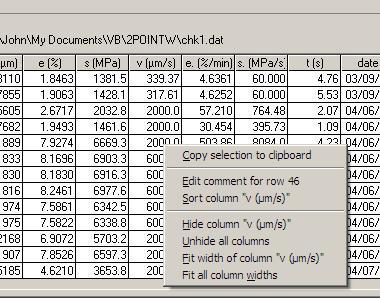
Many features of the result table can
be accessed by appropriately clicking directly in the
table; also, all features can
be accessed from the pop-up menu obtained by right clicking inside the
table:
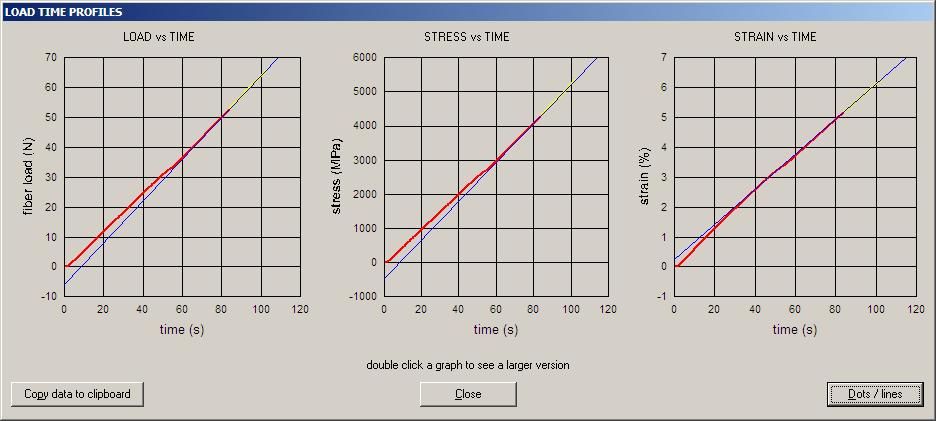
After breaking a fiber, TENSION for Windows graphs the load/stress/strain/speed profiles as a function of time so that the quality of the measurement can be assessed. A certain amount of slippage of the fiber on the capstans is inevitable and leads to some relaxation of the applied load during testing. This significantly perturbs the loading rate. An example for a fiber which was loaded at a constant stepper motor speed is shown below. (You might note that the strain behavior is a little different from the load and stress behavior. This is because the elastic modulus of silica is not constant but varies with strain - TENSION for Windows takes this into account when performing all its calculations.) The load/stress/strain all show some nonlinearity due to slippage. The stress rate for reporting is found by fitting to the yellow data (certain standard test procedures specify that the rate be determined from the top 20% of the load data, which are shown in yellow) and the regression line is shown in blue. Clearly, the fiber has not experienced a constant loading rate - worse, the loading rate varies from specimen to specimen due to differences in the wrapping so that some measurements might need to be discarded. This particular fiber was relatively easy to grip, but this is not always the case.
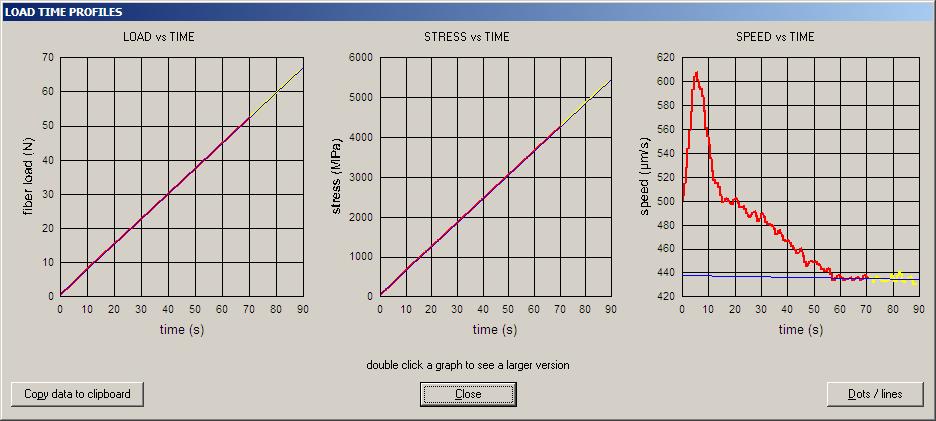
To overcome this difficulty, TENSION for Windows has two servo control modes (one for constant stress rate and one for constant strain rate) which adjust the stepper motor speed in real time in order to obtain the precise desired loading rate. The example below shows results for a servo controlled measurement. Now, the regression line fitted to the yellow data overlaps all the data and the fiber experiences the precise same loading rate throughout the experiment. The speed vs. time graph shows how the speed needed to be varied in order to maintain a constant loading rate. The servo control mode is essential for some fibers which have slick, slippery polymer coatings which are very hard to grip.
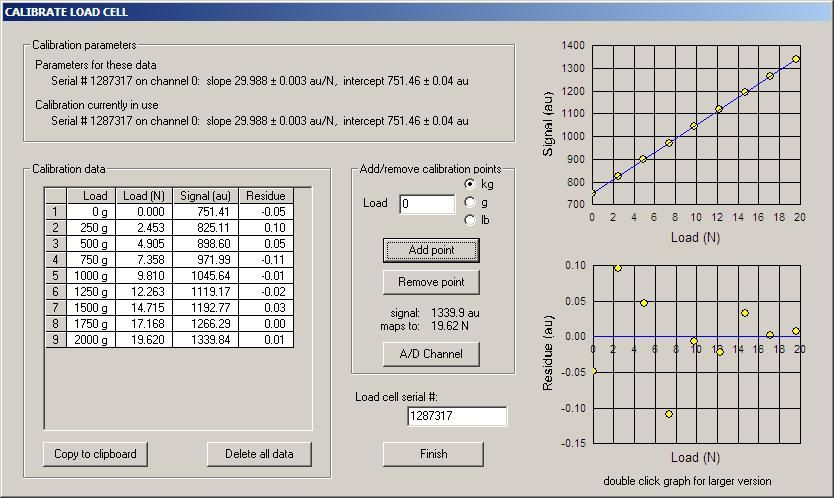
Strength measurement in tension is only as good as the calibration of the load cell. Calibration data for the load cell is supplied with the Tensile Tester, but for full compliance with standard test techniques, customers should calibrate the load cell themselves. Calibration is simply performed by hanging various weights on the load cell and measuring the response of the ADC system. This necessary calculations are then made by TENSION. Below is the main calibration window which shows a calibration in progress. Several weights have been applied and the load/response behavior found. Linear regression is used to generate the calibration constants - a residue plot aids in identifying troublesome calibration points (a swinging weight can spoil a measurement). Three A/D channels are available which have gain factors varying over a range of 5. This permits obtaining separate calibrations at low, intermediate and high loads. High strength 125 µm fiber typically breaks at around 60 N, while a damaged fiber (e.g. damaged by splicing or stripping) might fail at only a few N. Optimum precision for each case is obtained by choosing the appropriate A/D channel.
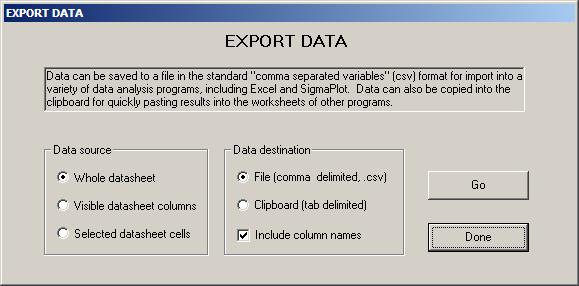 Data can be quickly copied to other applications by copying cells from the result table and pasting, or by using the Export Data menu (above). Data can be exported via the clipboard, or as tab delimited or comma delimited plain text files. These data formats are compatible with most applications and can be directly pasted, for example, into an Excel or SigmaPlot worksheet for further analysis and graphing.
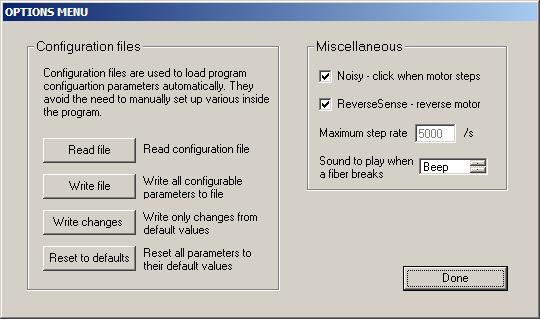 An options menu permits configuration of various program features. Configuration files can be read from and written to - these files contain lists of parameter values so that the software can be quickly reconfigured for different types of measurement.
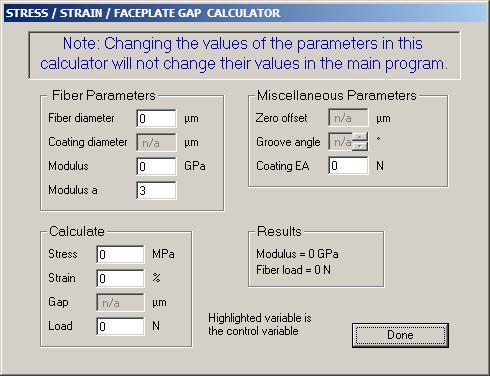
The above image shows the Calculator
which is built into
TENSION for Windows. It permits calculation of fiber stress and
strain,
and load for any given initial parameter. This feature is useful for quick
calculations for planning experiments, etc.
|
|